In recent years, the investment landscape has witnessed a remarkable shift, with alternative assets like sports cards gaining unprecedented attention alongside traditional stock investments. This burgeoning interest has spotlighted the potential of rare collectibles, such as the rookie cards of sports legends like Tom Brady, Michael Jordan, and Ken Griffey Jr., to compete with and sometimes outpace the returns of stalwarts on Wall Street, including Amazon, Apple, and Home Depot. This article delves into this investment showdown, unraveling the allure of sports cards developing into a formidable asset class.
The Rise of Sports Cards
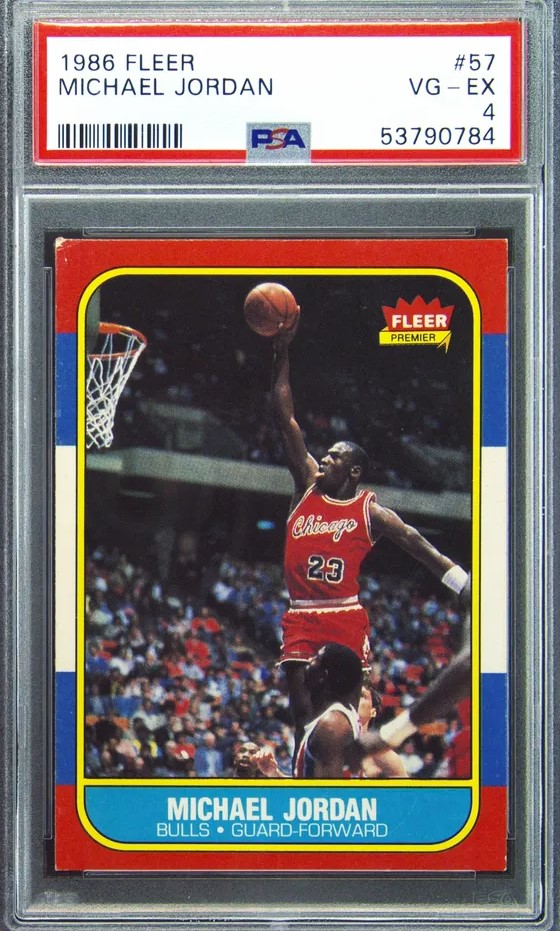
The realm of sports memorabilia has seen its own icons’ rookie cards, such as Tom Brady, Michael Jordan, and Ken Griffey Jr., ascend to heights rivaling those of traditional investments. Tom Brady’s 2000 Playoff Contenders Championship Ticket card, for instance, shattered records with a sale over $3 million in 2021. Similarly, the 1986 Fleer Michael Jordan rookie card, encapsulating the legend’s debut, now commands around $400,000 for a PSA 10 version, reflecting a surge in value that mirrors the most bullish stock market trajectories.
Ken Griffey Jr.’s 1989 Upper Deck rookie card, synonymous with baseball’s modern collecting era, has also seen its value skyrocket, especially for high-grade copies. This trend underscores sports cards’ emergence as alternative investments, where rarity, condition, and the legacies of the players depicted play pivotal roles in driving up prices.
Stock Market Performance Analysis
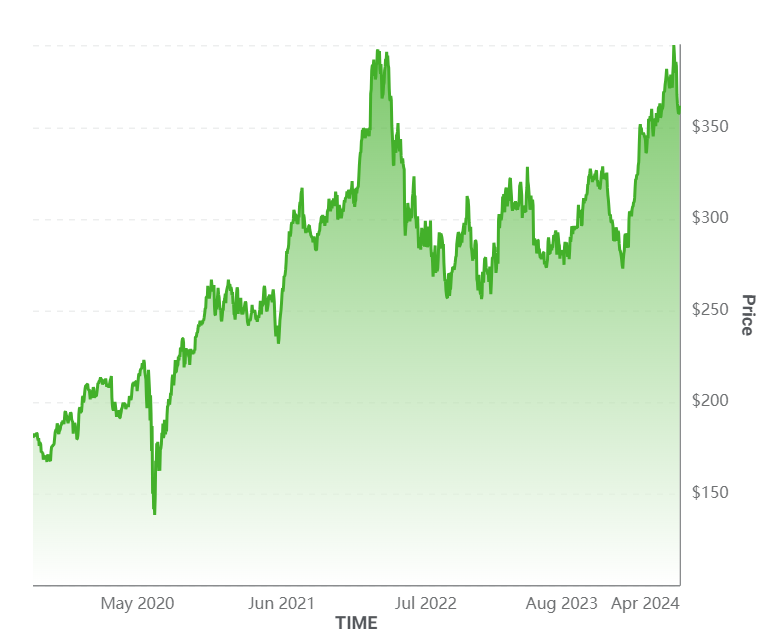
Contrastingly, the stock market has presented its narrative of growth over the same period. Amazon, with its 101% increase, Apple’s uphill rollercoaster ride culminating in over an 240% uptick, and Home Depot’s steady climb of approximately 77%, showcase the dynamic and diverse nature of traditional investments. These figures underscore the robustness of the stock market, driven by innovation, consumer trends, and economic indicators that dictate the ebb and flow of share prices. So which investment is wiser, sports cards or traditional stocks?
Sports Cards vs. Stocks – An Investment Comparison:
When comparing sports cards to stocks, several factors come into play. Stocks, tied closely to the company’s performance and broader economic conditions, offer liquidity and the potential for dividends but come with market volatility. Sports cards, on the other hand, offer a tangible asset whose value is less influenced by market swings and more by scarcity, condition, and cultural significance. Let’s dive into a few matchups of sports card versus wall street.
1989 Upper Deck Ken Griffey Jr. #1 PSA 10 #1 vs. Home Depot Stock
1989 Upper Deck Ken Griffey Jr. PSA 10 #1:

Home Depot Stock:
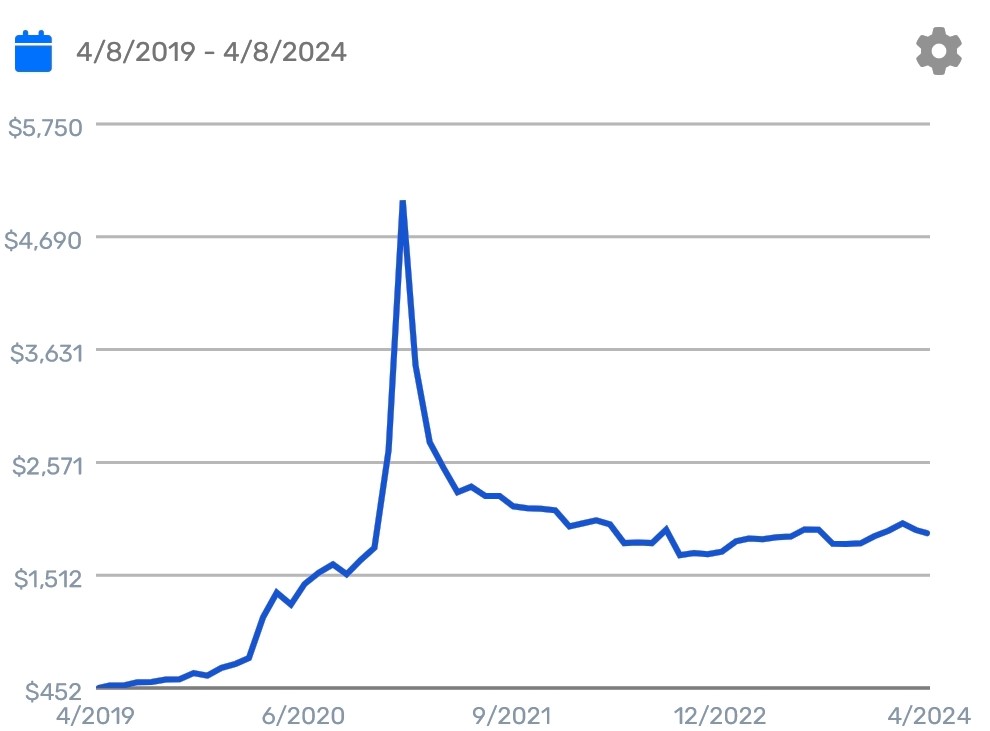
Moreover, the 1989 Upper Deck Ken Griffey Jr. PSA 10 slightly edges the great Wall Street stock that is Home Depot on the 5 year return. With the Griffey Jr. PSA 10 hitting a 5 year clip at just under a +346% return, and the Home Depot stock eclipsing a +77% return via 5 year; the Jr. rookie card almost doubles the Home Depot stock return.
Let’s do a brief example showing the data. Let’s say we were investing $10k on April 9th, 2019. At that time the Home Depot stock was $203.85 per stock give or take. The 89 Upper Deck Ken Griffey Jr. PSA 10 rookie was valued at $454.00 give or take per card.
If we bought:
$10k worth of Home Depot stock in 2019 we would have 49.05 shares | $10k worth of Ken Griffey Jr. PSA 10 rookie cards in 2019 we would have 22 cards.
5 years later – 49.05 Home Depot shares x $362.05(current stock price) = $17,758(+77%).
5 years later – 22 1989 Upper Deck Ken Griffey Jr. PSA 10 rookie cards x $1,960(current card value) = $43,120(+346%).
Now, Home Depot pays out dividends per year on average over the last 5 years of about 1.7% per stock each quarter. For basic over the top math here we’ll say a $13,500 annual stock value each year x 1.7% per quarter. This would leave us with an additional $4,590 earned, totaling the total Home Depot return at just over $22k($22,348).
With the first comparison in the books the 1989 Upper Deck Ken Griffey Jr. PSA 10 rookie($43,120) almost doubled the Home Depot stock with dividends($22,348) value. A true catalyst here showing that the right sports card can be just as, if not more valuable than the right stock. I don’t know about you but there’s also something very enticing about the tangibility of holding 22 PSA 10 Jr. rookies in your hand.
2000 Bowman Chrome Tom Brady PSA 10 #236 vs. Apple Stock
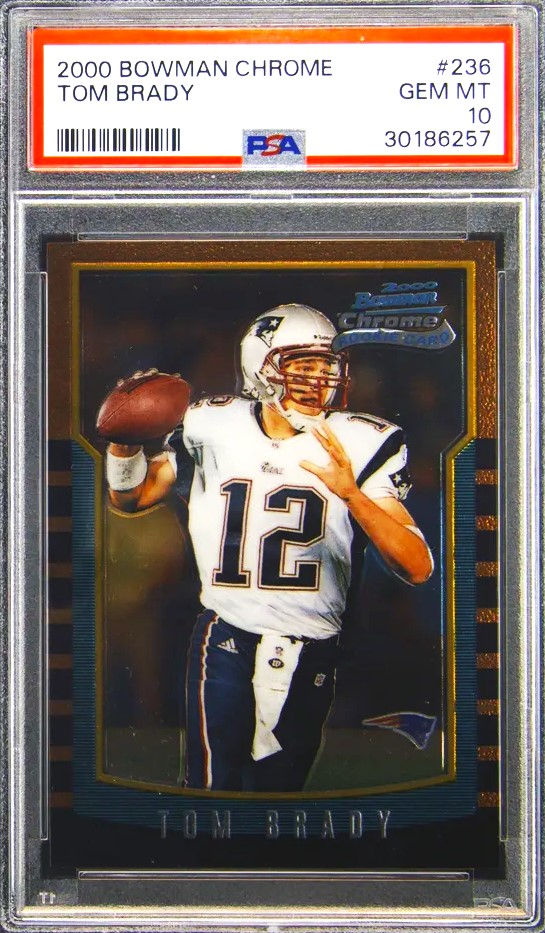
2000 Bowman Chrome Tom Brady PSA 10 #236:
Apple Stock:
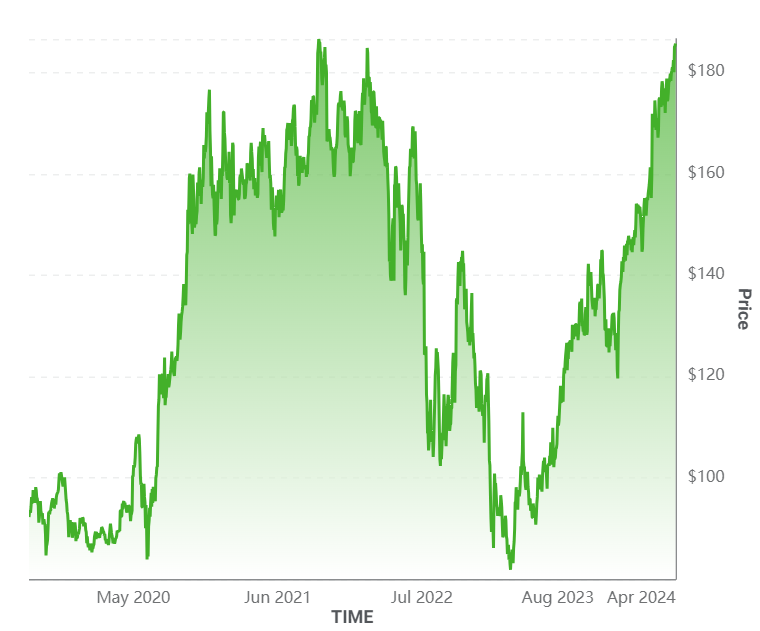
What an impeccable comparison between the Goat of Football himself Tom Brady and a premium investment stock in Apple products. As you can see with the data, the sports card world absolutely exploded during the Covid pandemic whilst stocks in general took a brief fall. Sports cards have since come back to reality and look to be hitting their new bottom post pandemic market. Whilst you really cannot go wrong with investments of high grade Tom Brady rookies or the top cell phone manufacturer in the world Apple, let’s delve into another brief $10k investment example from 5 years ago in 2019.
Perhaps we invested $10k on April 9th, 2019. At that time the Apple stock was $50.97 per stock give or take. The 2000 Bowman Chrome Tom Brady PSA 10 rookie was valued at $1,690 give or take per card.
If we bought:
$10k worth of Apple stock in 2019 we would have 196 shares | $10k worth of 2000 Bowman Chrome Tom Brady PSA 10 rookie cards in 2019 we would have a mere 6 cards.
5 years later – 196 Apple shares x $169.67(current stock price) = $33,255(+241%).
5 years later – 6 2000 Bowman Chrome Tom Brady PSA 10 rookie cards x $7,102(current card value) = $42,612(+318%).
Again, Apple pays out a very small dividend per year on average over the last 5 years of about $0.96 per stock annually. Displaying some brief math again here we’ll say 196 shares x $0.96 =$188 of dividends annually . As displayed, this would leave us with an additional $188 earned, totaling the total Apple return at $33,443.
On first comparison, it looked like the Apple stock was the better option here. Though it still may be, the 2000 Bowman Chrome Tom Brady rookie cards narrowly out gained the electronics monster in Apple.
1986 Fleer Michael Jordan PSA 4 #57 vs. Amazon Stock
1986 Fleer Michael Jordan PSA 4 #57:

Amazon Stock:
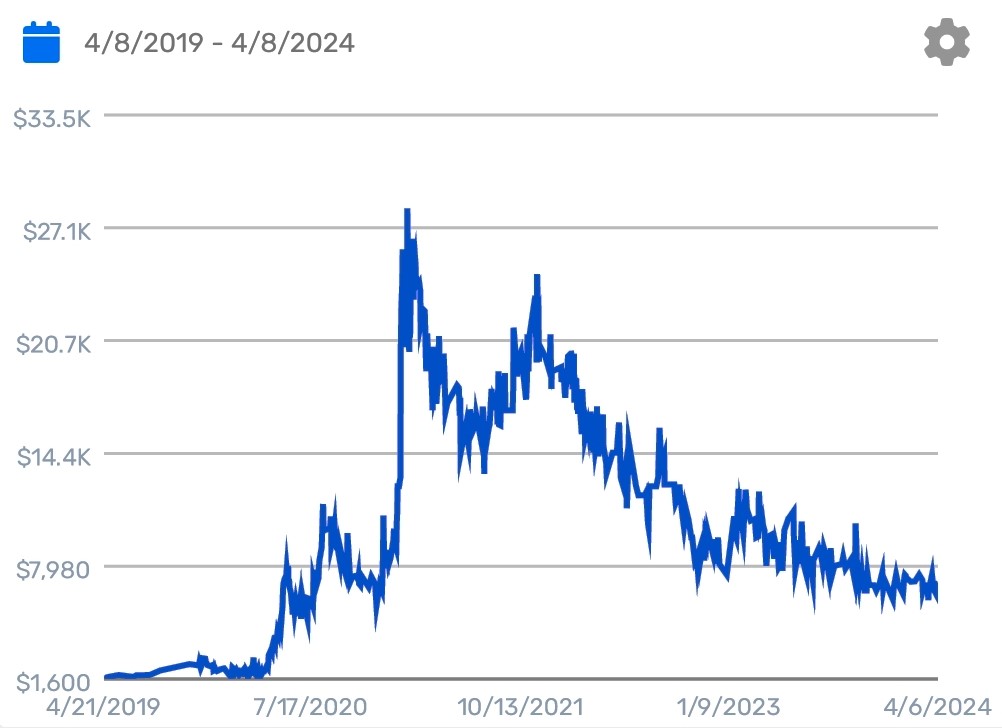
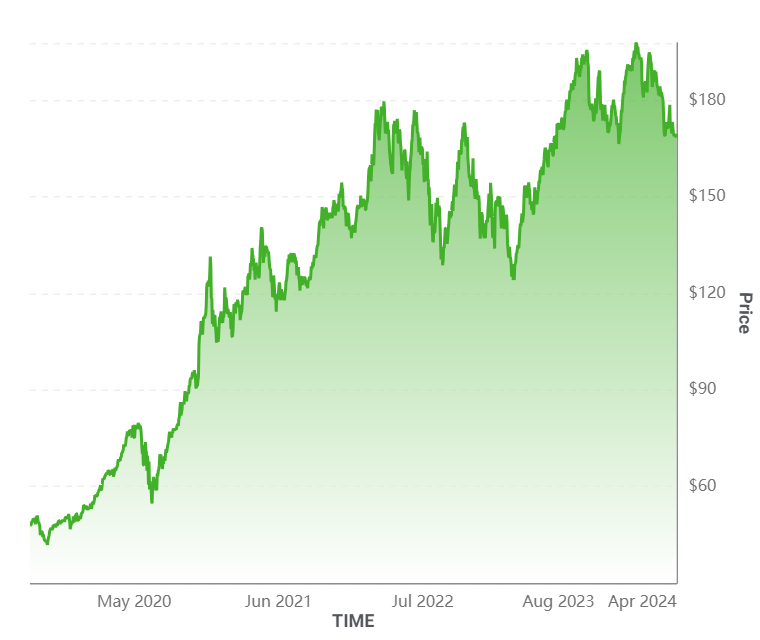
On the Michael Jordan rookie card spectrum we used a lower grade PSA card due to the extreme value amounts a PSA 10 Jordan brings. In comparison to the Amazon stock we didn’t feel it was a correct comparison. For knowledge purposes however the 5 year return on a Jordan PSA 10 currently sits at a whopping +477%. That’s neither here nor there, contrastingly, we compiled the data from a Michael Jordan PSA 4 above against the retail giant known as Amazon. To much of our surprise, the PSA 4 Fleer Jordan rookie holds it own against the market giant Amazon. Compiling a sizeable +227% gain in the most recent 5 year span, this rookie card seems to be one to grab ahold of in any grade. Amazon has secured a very nice overall 5 year return of its own displaying a sizeable +101% return for its investors.
One lasting 5 year investment example for these 2 giants. We have $10k on April 9th, 2019. At that time the Amazon stock was $92.15 per stock give or take. The 1986 Fleer Michael Jordan PSA 4 rookie was valued at $980 give or take per card.
If we bought:
$10k worth of Amazon stock in 2019 we would have 109 shares | $10k worth of the 1986 Fleer Michael Jordan PSA 4 rookie cards in 2019 we would have 10 low grade MJ rookies.
5 years later – 109 Amazon shares x $185.67(current stock price) = $20,238(+101%).
5 years later – 10 1986 Fleer Michael Jordan PSA 4 rookie cards x $3,200(current card value) = $32,000(+227%).
Amazon does not pay out dividends to its stock holders. Making this another narrow victory for the sports card investor.
The Tangible Appeal of Sports Cards
We discussed this above, but one of the most compelling aspects of investing in sports cards is their tangible nature. Unlike stocks, which represent a digital slice of a company’s value, sports cards are physical items that collectors can hold, display, and enjoy. This tangibility brings an added layer of emotional investment, connecting collectors not just to the financial worth of the card but to the history, legacy, and nostalgia it embodies. The vibrant colors, intricate designs, and the very texture of the cards make them not just assets but pieces of art, capturing moments of sporting greatness that resonate on a personal level with enthusiasts.
Conclusion
The comparison between sports cards and the Wall Street stock market unveils interesting insights into investment strategies and the dynamics of financial markets. While sports cards offer that tangible and nostalgia-driven asset class that can provide enthusiasts with both emotional and potential financial returns, the stock market presents a more complex yet diversified avenue for wealth accumulation.
As investors navigate these two distinct realms of investment opportunities, it becomes apparent that a balanced portfolio may incorporate elements from both worlds. Sports cards can serve as a unique alternative asset that adds diversity to one’s holdings while offering an enjoyable tangibility aspect of assets.
Conversely, the stock market provides access to a broad range of industries, sectors, and global markets, enabling investors to capitalize on economic growth and innovation. Ultimately, the juxtaposition of sports cards against Wall Street stocks underscores the multifaceted nature of investing and the importance of thoughtful decision-making in building wealth over time.
By combining passion with prudence, investors can embrace the excitement of collecting memorabilia while leveraging the power of financial markets for long-term prosperity. This comparison above encourages individuals to explore unconventional avenues for investments while recognizing the enduring value of sports cards as no longer just a hobby, but a tangible asset class to be reckoned with.
Rookie Sports Card is reader-supported. When you buy through the links outside of our website, we may earn an affiliate commission from Ebay and Amazon.
Article Credits: Data used (Market Movers, Motley Fool)
As always, thank you for your support!


2 thoughts on “Beyond the Field: Comparing the 5-Year Surge in Sports Cards vs Wall Street Titans”
Comments are closed.